

How Peak to Valley (PV) and Root Mean Square (RMS) Affect the Quality of Your Optic
Just how smooth is the surface of your optic? Qualitative descriptions are of limited value, and often you’ll want to put a number to it. Two ways of quantifying deviations from an ideal optical surface are peak-to-valley (PV) and root-mean-square (RMS). While root-mean-square provides more information, peak-to-valley measurements have been used more often historically. Both methods have their pros and cons. Here we’ll look into both in more detail.
Understanding Peak to Valley (PV) Measurements
A peak to valley measurement represents the distance between the highest point and lowest point on the surface of an optic. Theoretically, this number should be quite useful: for instance, it allows an optical designer to make worse case predictions on optical performance. In practice, though, it is much more problematic. Using peak to valley measurements assumes that all measurements are precise and the surface has no noise. It is most useful if there are large sized features on the optics, or if the order of aberration is low.
An actual optic will have numerous imperfections that are closer than a millimeter to the aperture. Measurements from peak to value will be taken with an instrument that is far from ideal; typically, it will have a significant noise level and a large MTF difference. Because of the inherent problems with measurement, optical manufacturers typically have their own measuring method which does little but mask the condition of the optic. Often the measuring instruments are only used to interpolate the standard parameters in a method based more on a study of optical properties rather than the actual optic under consideration.
Unfortunately cost and manufacturability are often expected to depend entirely on the value of PV. For instance, we have had customers come in with a minimum budget requesting a 1/10 wave PV optic, with no specifications on testing conditions. This type of demand can only lead to a prohibitively expensive optic, an unworkable project, or the specification reinterpreted by the vendor. Standard manufacturing processes do not admit for 1/10 wave PV.
Understanding Root Mean Square (RMS) Measurements
A root mean square (RMS) measurement describes the average deviation of the actual optical surface from an ideal surface. While PV gave the ‘worst case scenario’, we can think of RMS as providing the overall surface variation. RMS values are also dependent on measurement, and especially on the relative area of the optic sampled. However, they are typically much more informative than PV values.
While some may attempt to convert between PV and RMS measurements by multiplying by 3.5, this is inaccurate and misleading. The two numbers are measuring very different things, and there is a simple relationship between them. A surface may have a large gouge that results in a large PV, but if the rest of the optic is smooth the RMS will reflect that. Similarly, if a surface has a relatively small PV but the surface is completely rough, the RMS will be larger than expected by a look at the PV.
Comparing RMS and PV Measurements
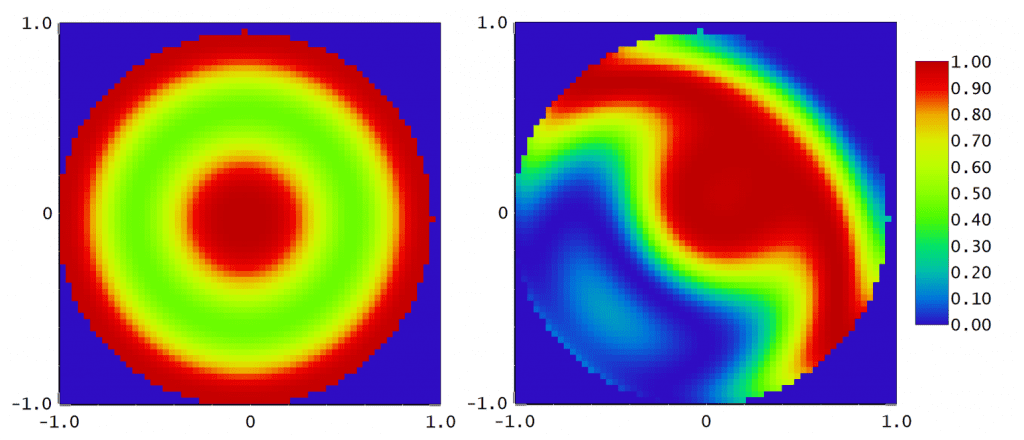
Below are images which show the plot of 1 micron PV for basic terms of aberration, as well as the corresponding RMS. We see RMS is noticeably different for each basic term of aberrations.
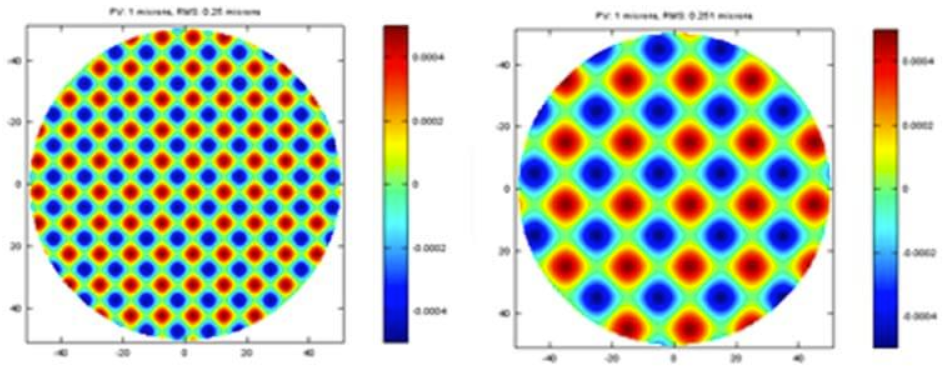
When computer-controlled sub-aperture polishing comes into play, we often see cyclic errors. The below plots again show 1-micron PV, but here we have different frequencies of cyclic error. Though you can align pretty much all of the basic aberration in your optical system, cyclic form error will typically not be compensated for. In these images you can see that the PV and RMS measurements end up being essentially the same as basic aberration terms.
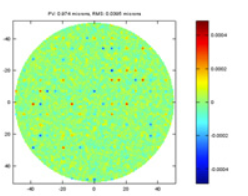
Now consider the below image, which shows the stimulated plot of an optic where the error consists of many small imperfections and a few larger, localized imperfections. A well fabricated optic will typically be of this kind. In this situation, the PV is still close to the 1 micron we saw in our other plots; RMS, however, is much less. These plots demonstrate how RMS reflects the actual surface quality of the optical system, while PV provides hardly any useful information.
RMS is a better specification than PV, but as always, the key is to partner with a trustworthy optics supplier that can work with you to manufacture an optic with the best performance possible at your price point. At Avantier Inc., that’s what we do every day. Contact us for a free consultation, and put our 50+ years of optical experience to work for you.